this morning I discovered tableau gives out free full-featured product keys to university students (https://www.tableau.com/university-students).
I have been looking for data analysis and data visualisation tools ever since getting VIP access at the greynoise event in London.
exciting times ahead.
[this is a long one, expect to take a detour or three.]
a new map for a new territory
introduction
my usage of tableau so far:
- created an account on tableau dot com
- registered as a student
- immediately received a product key
- beautiful. seamless. no hoops to jump through. love it
- downloaded tableau
- did not complete a tutorial
- we die like men etc etc
- to be clear, I 100% plan to
- ran the following sample query on greynoise:
destination_country:"Ukraine" spoofable:false classification:malicious single_destination:true- exported the results as .csv
- loaded it in tableau
- “oh look maps! cool let’s plot number of IPs over country”

- ah, yes. beautiful.
the territory: access
here’s the thing: I am very aware that as a civilian academic, there isn’t much I can do about access. I get to see what people want me to see, nothing more and nothing less. I know I study very sensitive issues, I understand the need for secrecy around them, hell I even like classification systems (all markings are good markings EXCEPT FOR NOFORN. NOFORN CAN DIE IN FIRE – one day I’ll elaborate).
back to access, or, better, lack thereof. I’ve always thought it a fact of life that I wouldn’t get access to anything beyond laws and publicly disclosed information, and I learned to make my peace with it. it was maddening, it was saddening, but it was not something I could change.
it was also one of the main reasons why I doubted the feasibility of starting a phd. original research, yes, but on what? pure international law, when so much of my training is in something else? OSINT – sure, but why? so many of the good research questions I thought of would lead me to work years on devising well-informed guesses about information that actually exists, just, not in public. as I’ve been told once: “it’s like you’re doing investigative journalism!”.
it was clear to me that internships and analytical work at non-profits would be the closest I got to having access to actual data for research. shout out to the dpa and dnsrf, which gave me a sliver of hope and a reasonable amount of content. living on the edge, with public data and confidential insight, I thought, this will do. and shame to Italy, my home country, where I never got close to getting even there.
and then I got greynoise vip.
all of a sudden, I had data – more data than I ever thought. more data than excel wants to look at. literal big data! insert expletive of your choice, I probably thought of it.
see, I had data, but no way to think about it.
the map: tools
if you spend three and a half years of your five year long master’s thinking you’ll only ever get to read laws and policies, even though all you care about is cyber infrastructure, you get used to it. dare I say, you get good at it. I’m now around the six-month mark of getting paid to read and parse policies related to digital stuff. it’s a skill, it’s a niche, I like it.
but if all of a sudden you get access to the forbidden trove of data; of enriched logs of IP addresses interacting with a honeypot, that you are explicitly allowed to use for research. what good are your law-reading skills now? useless, that’s what they are.
I want to be clear on one thing: this is good.
it’s good to be challenged to learn new tools, it’s good to learn data science as something other than a keyword to put on my resume, and, most obviously, it’s good that I have a lot of very cool data to work with.
yes, it feels very weird to be so thoroughly ill-equipped for something that falls so clearly within my research interests. yes, I feel the attrition of the learning curve which is entirely ahead of me.
but there is a world of possibilities ahead. if I learn how to use data analysis tools well, I won’t only be able to give better answers to questions I already have; no, by knowing what kind of questions I can ask of the data, I will also be enabled to actually ask them. I will have more research questions and I will know I have the data to solve them as well as the math (le gasp!) to back them up.
conclusion
consider me converted to the quant way.
well, consider me the most junior padawan of the quant way.
if you want to continue thinking that I am smart, please stop reading here. I look forward to learning the ropes of tableau, and of more software, soon enough.
I keep waiting for the muse to strike me with inspiration as to what queries to ask of this beautiful data.
I’m happy about this, and I’m going to be even happier.
ok. here begins
a tragedy in three acts
crossing the river by touching the stones
setting the stage
see, at the bottom of that beautiful world map I pasted above, I noticed a little flag:

- “oh just one error! what is this value”
- “…”
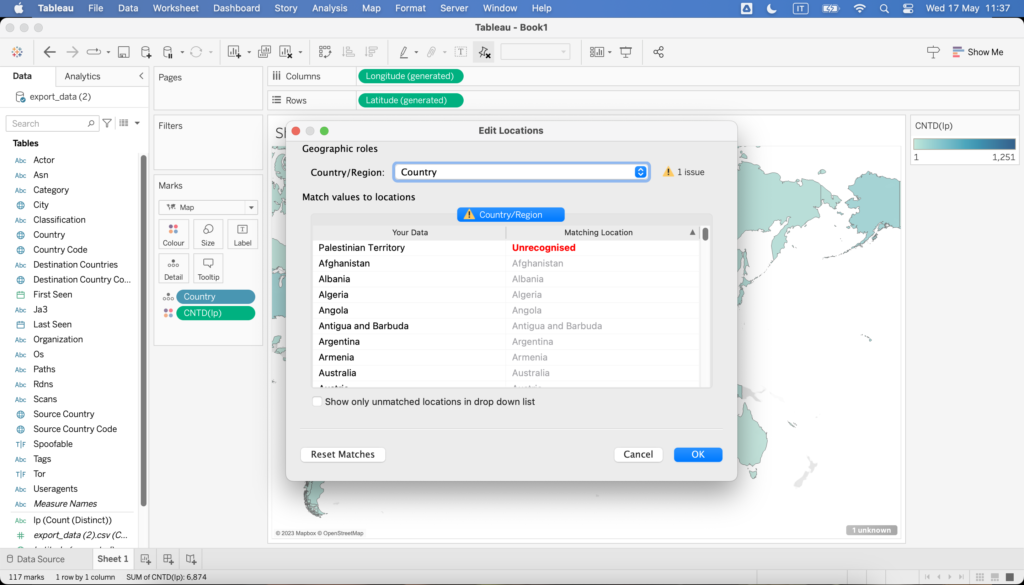
let me zoom in on that for you:
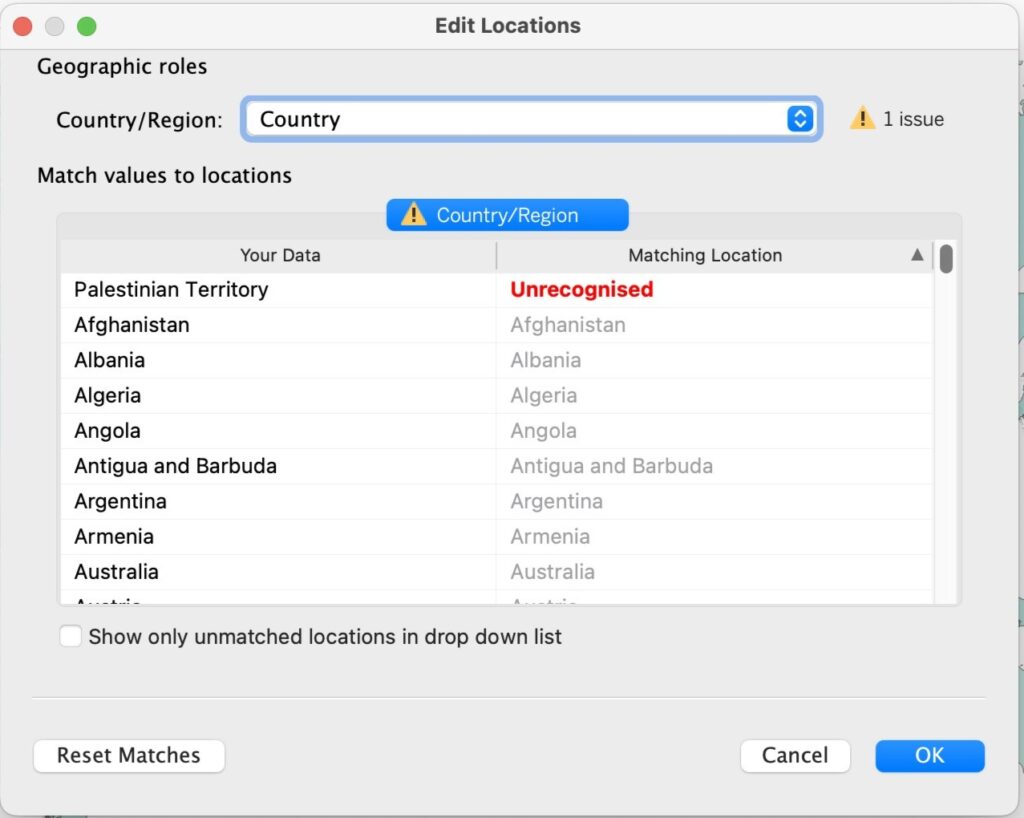
hermeneutics interlude
I have feelings about this.
I am a firm believer that the map creates the territory, the language shapes the thought, that sort of stuff. the relationship between means and meanings, tools and content, process and result.
so let’s talk about this a little bit, shall we?
see, technical people in cyber often criticise social scientists for talking about things they don’t understand, which makes them look like fools.
social scientists often look down on technical people for not applying basic critical thinking skills to their work, which makes them look like idiots.
I am, currently, at a very high risk of being both a fool and an idiot.
I think what happened today with this first trial really sums up the reason why.
interdisciplinary chaos
having an “Israel” value but not recognising the value “Palestinian Territory” feels like the kind of blunder technical people would commit. how dare they? it is, as literally everybody knows, one of International Relation’s hottest, most contested issues.
what if my data covered just those two entities: how would I chart it then?
and what level of political violence am I asked to be complicit in, if the only way in which I can account for that data is to merge it with the “Israel” label?
do the people who coded this stats program understand that what they are asking me to do is to actively, explicitly, endorse the one state solution in favour of Israel – with no option to do the opposite, in case that was where my personal political views fell?
and, most importantly, that they are not providing with the option to say: this is a contested issue. I will not solve this, no matter how good I am at it, no matter how many papers I read or cite, no matter how many disclaimers I add; because if there was a right and feasible way to solve it, it would have already been solved; because you can’t deny Palestine’s righteous claims any more than you can deny the factual existence of Israel, and…
as a social scientist, I cannot be required to solve the israeli-palestinian conflict as a prerequisite of analysing a bunch of IP addresses exhibiting malicious behaviour targeting Ukraine. it’s just not how it works. the paper does not focus on that. and the idea that there can be such a thing as a correct solution of this problem is in and of itself a huge assumption, one that I would not feel comfortable making even if I were expressing my personal opinion, which I am not, because-
as a social scientist, I cannot solve this by just going for whatever solution aligns with my personal political views of the israeli-palestine conflict (which also assumes that my personal views would be so simple as to align with a one-state solution in favour of either, which, hot damn). in fact, for the purpose of the research I am conducting on this, I should not even be required to have a personal opinion on the israelo-palestinian conflict, but-
as a social scientist, I cannot just shrug and merge the “Palestinian Territory” data into the “Israel” data, just to account for it, on the basis of that being the default option presented to me by the data visualisation program I am currently using. this would be anathema to my formal education, which prides itself on providing a comprehensive view on the interactions within complex systems. right now, at the first step of the analytic ladder, and for the purpose of the analysis I am currently conducting, I may not think the distinction between the two categories matters all that much. (spoiler alert: in this case, I wouldn’t be comfortable with that assumption, because “Israel” – regardless of its political reality and international recognition and conflict with the “Palestinian Territories”; but not independently of these factors – is a very relevant cyber power). but even if I were comfortable with this assumption, it would be a bad assumption, and far too early to do this kind of thing and
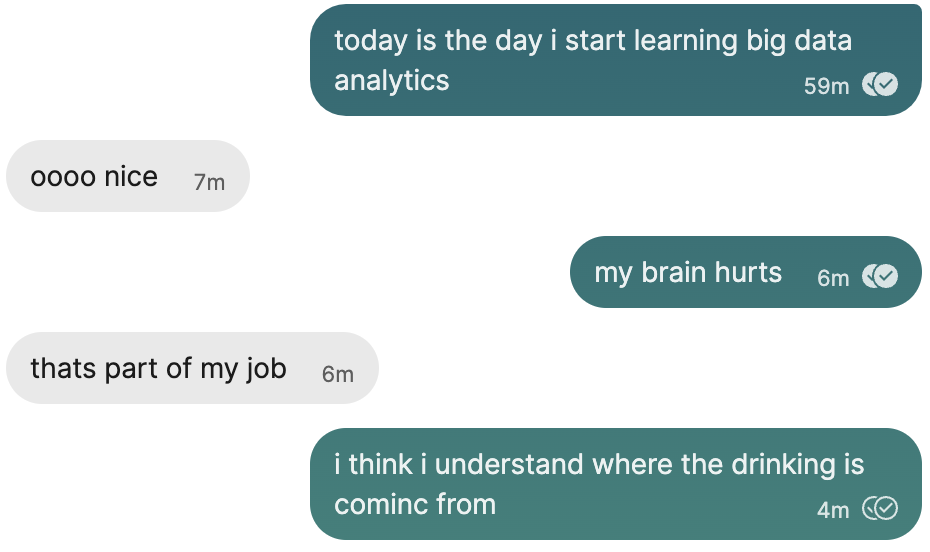
the third act
so.
you know.
my brain is fuming a little bit.
which means that this is the perfect moment to insert my second attempt at this (science, am I right?):
wait. WHAT?
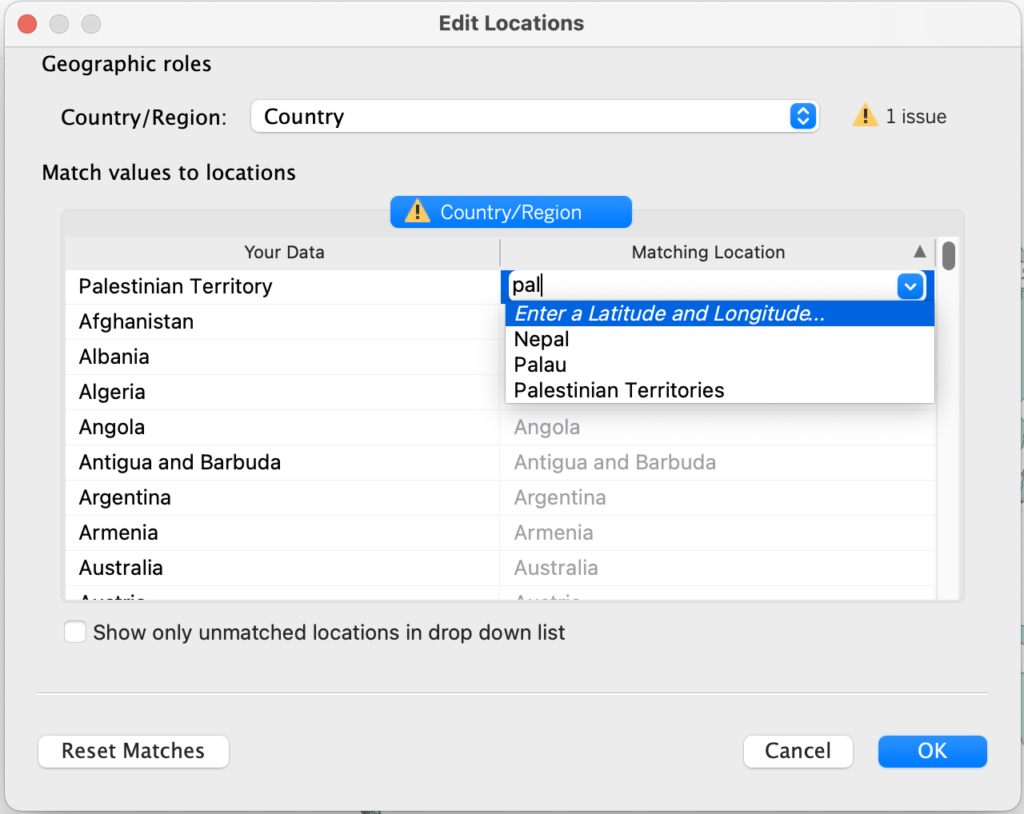
fin
dear reader, I hope you have enjoyed the laugh at my expense. please, don’t rush it, because I am going to milk this for all its worth.
see, sometimes, I am a fool and an idiot, but not because of big disciplinary challenges. just because I am nothing but a little guy trying to do big things. sometimes, I don’t notice an option in a dropdown menu, possibly because of a typo in the input, and I go on a long, convoluted rant on hermeneutics.
you see, I know enough about social science to be very aware of tech’s many blinds spots and shortcomings. but sometimes I try to use a new technical tool and pretend I know enough about its functioning without reading any of the documentation. hell I even think of drawing conclusions based on, just, vibes.
this journey to learn more tech stuff is going to make me a better social scientist. not (just) because I’m going to get more mileage out of my data, but because I’m going to have to look at my biases right in the eye before I chuck them in the trash, preventing them from getting to the data.
and yes, “tech people really don’t care enough about international politics” also counts as bias.
thank you to tableau and greynoise for giving me free educational access to their stuff. as you can see I am getting education aplenty from it.